The training set comprises the watchlist images and the probe images of 90 subjects. In the watchlist, 3 images of the subject's head are provided: 1) frontal image; 2) left-side image; 3) right-side image. In the probe images, 5 images of each subject are provided.
Fig. 1. Example images of the watchlist.
The identity of each image is provided in the image filename with following structure:
ID_type.jpg
Example for the 3rd subject in the watchlist
003_r.jpg - the right side watchlist image
003_l.jpg - the left side watchlist image
003_f.jpg - the frontal watchlist image
003_01.jpg - the 1st probe image
...
003_05.jpg - the 5th probe image
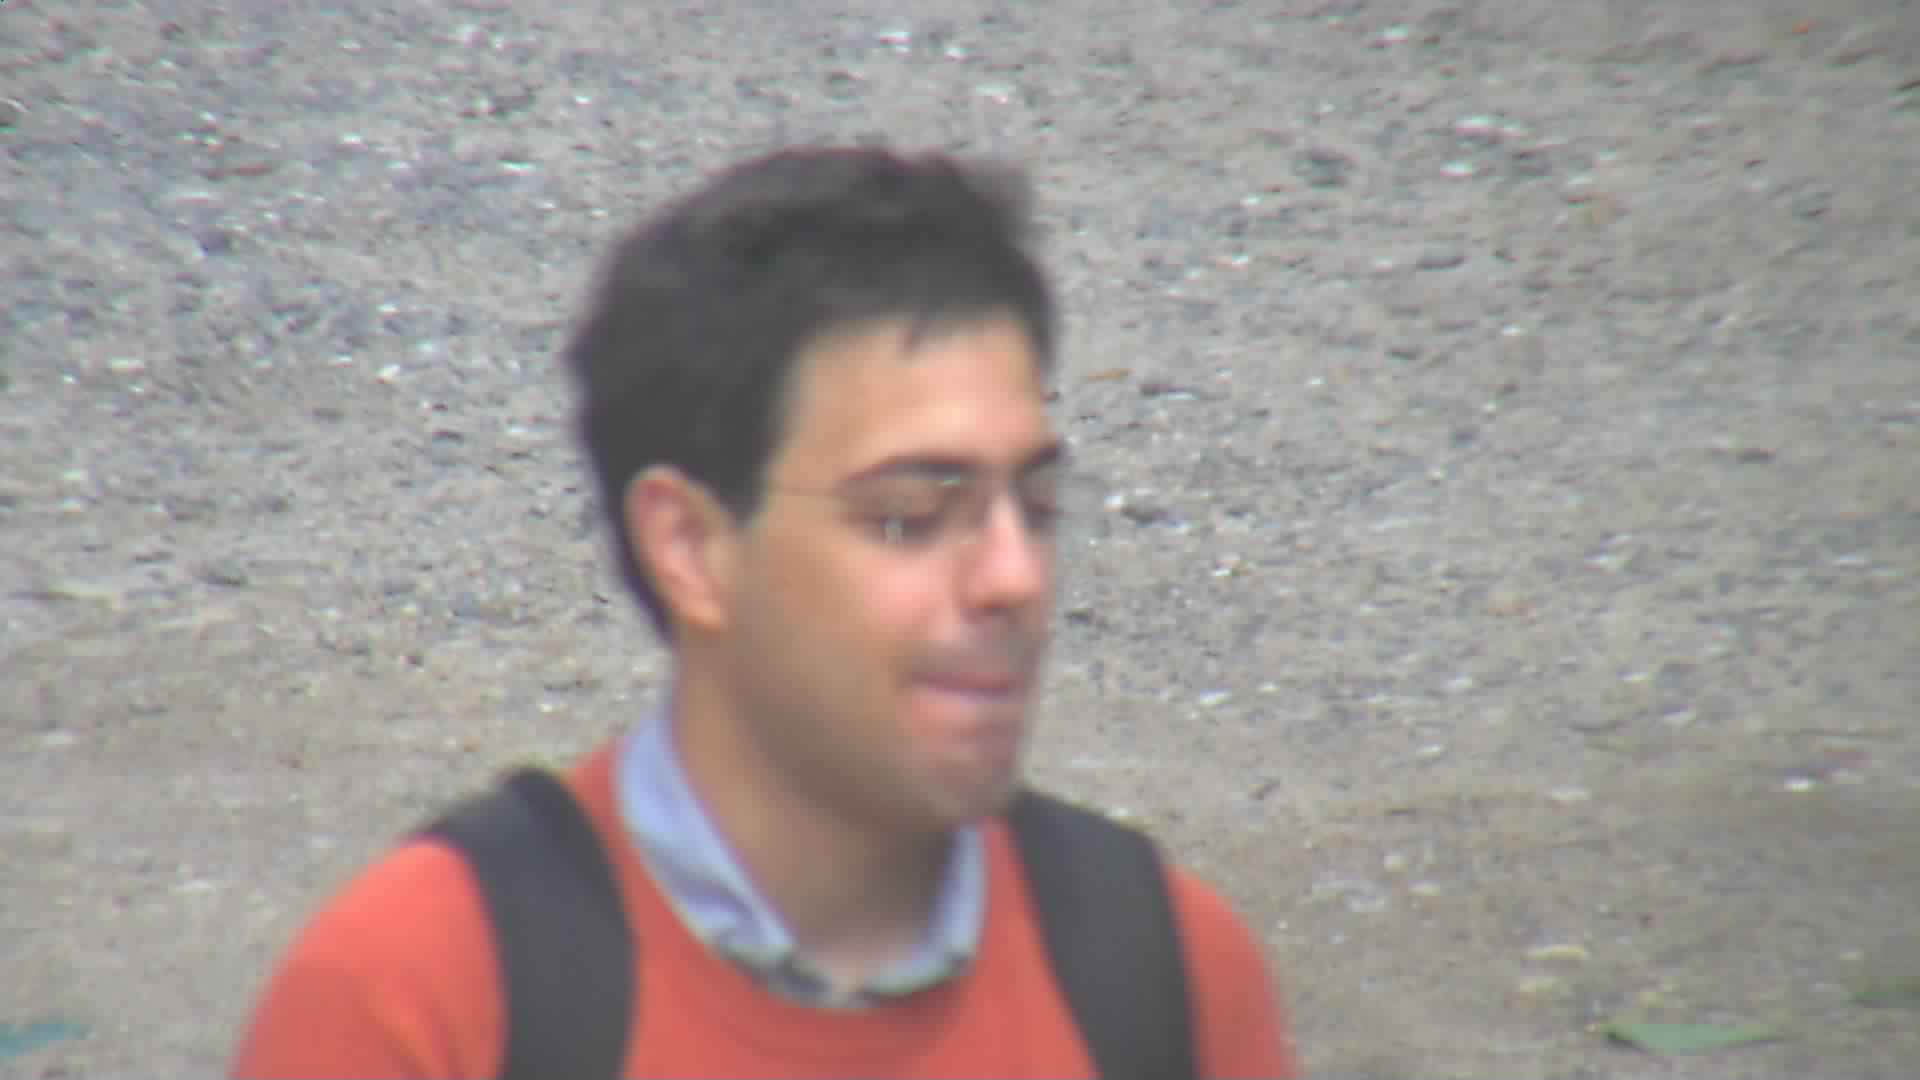 003_01.jpg
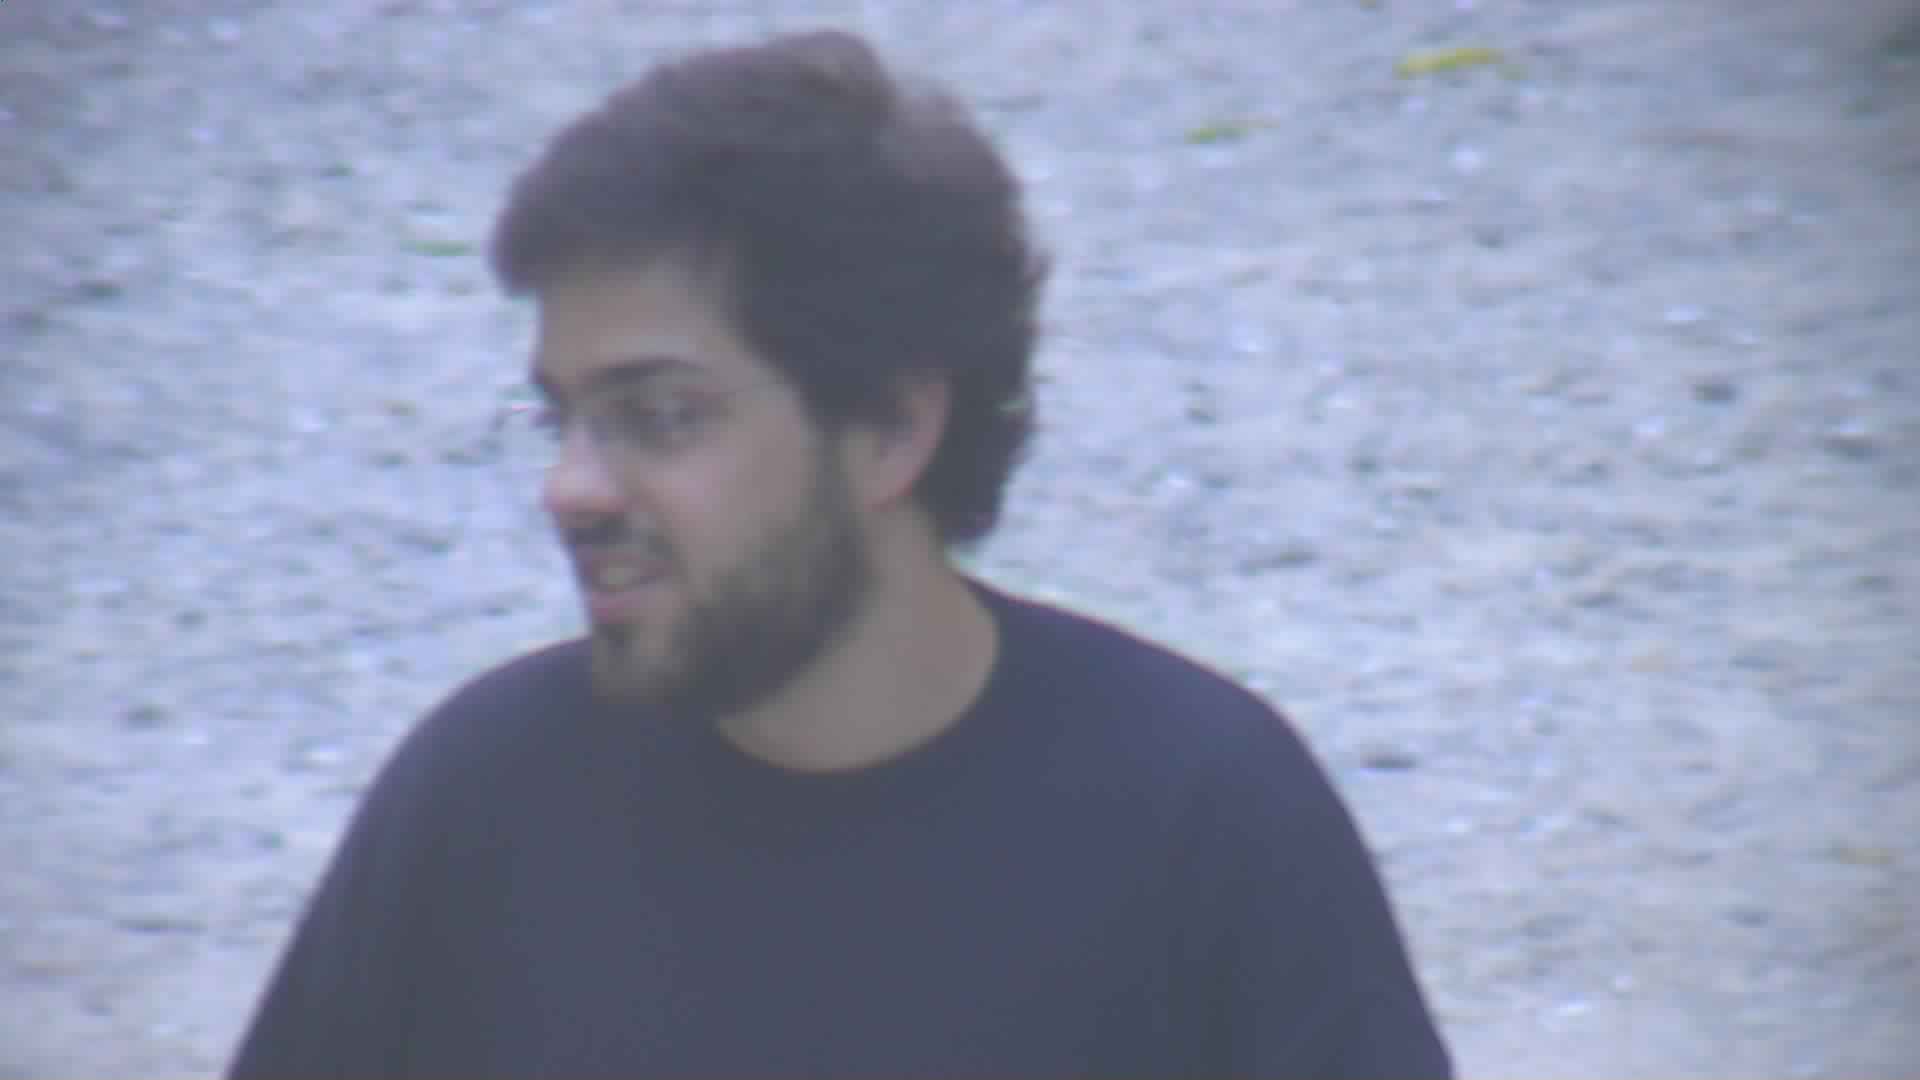 003_02.jpg
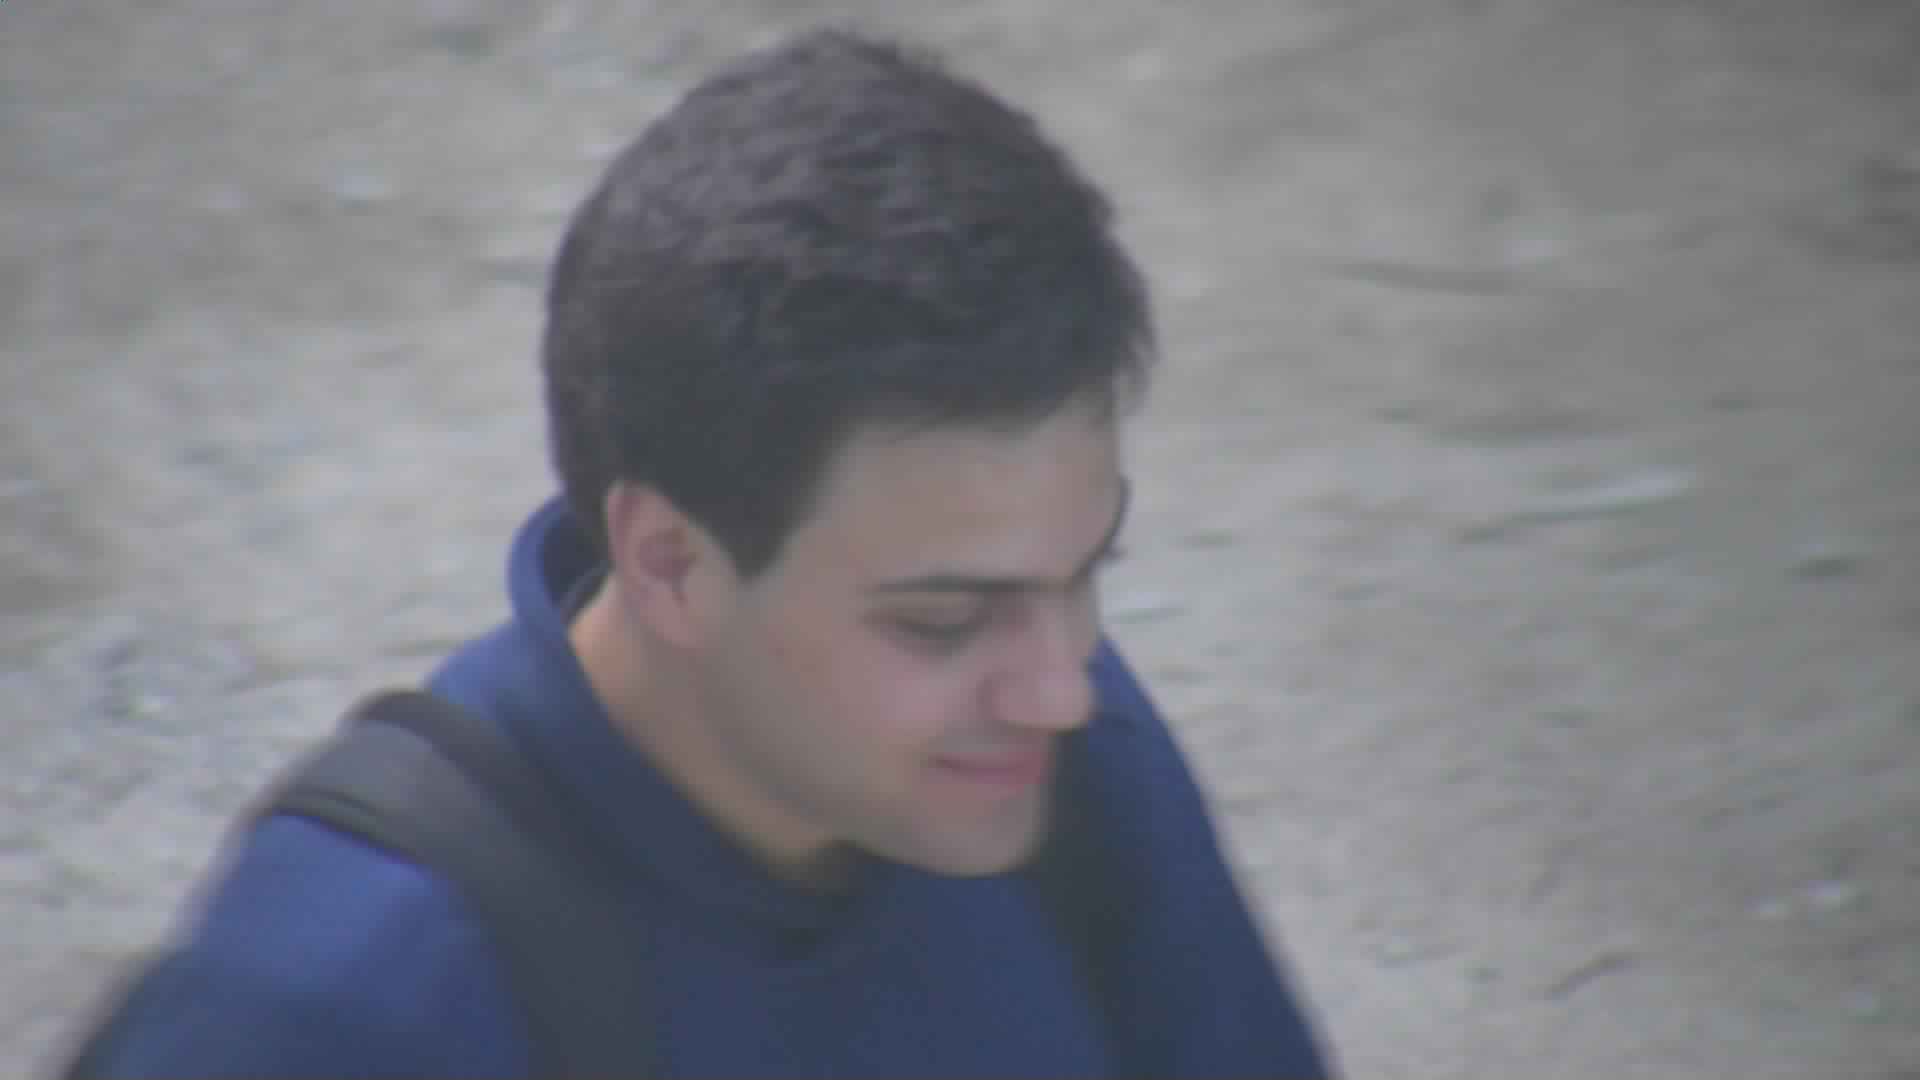 003_03.jpg
 003_04.jpg
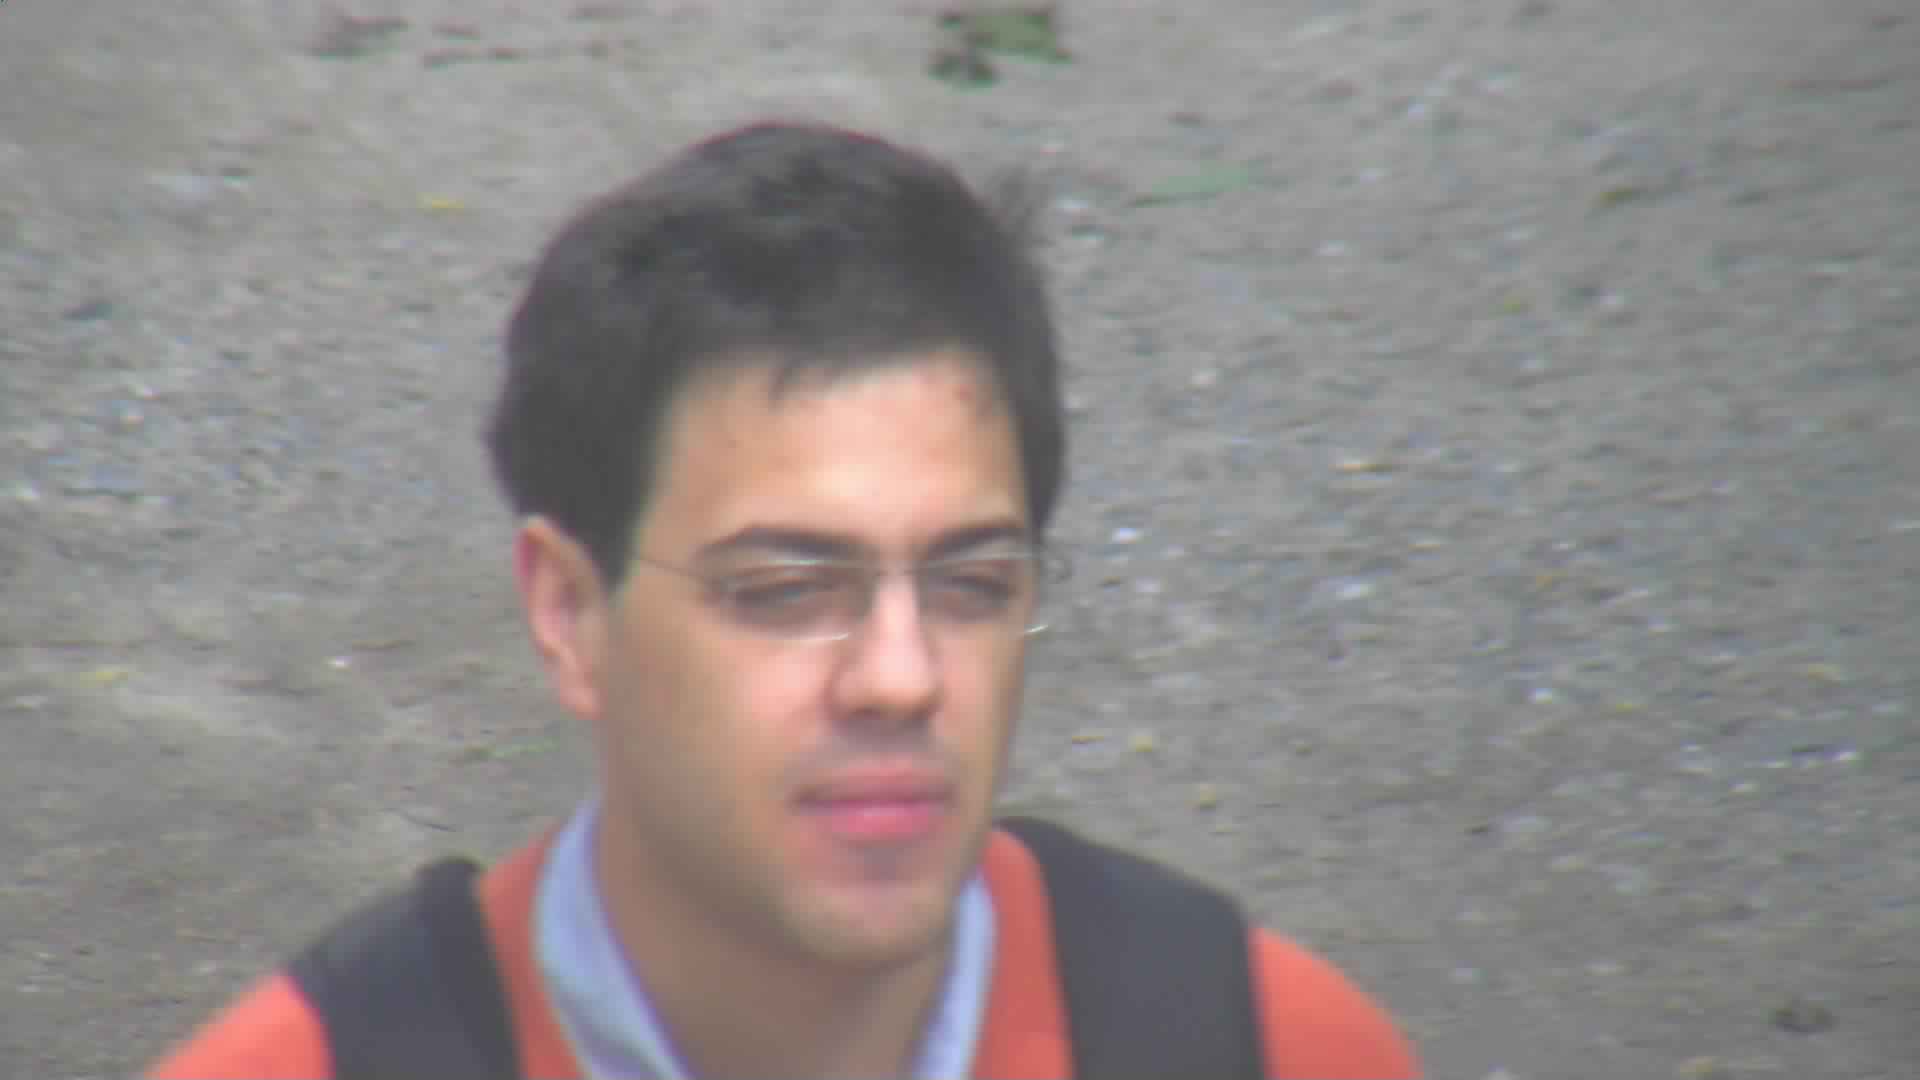 003_05.jpg
Fig. 2. Example probe images.
Considering that, in some cases, images contain multiple subjects, the face location of the interest subject is provided as a bounding box. These data was automatically inferred using a state-of-the-art head-landmark localization method [1] and corrected manually. The annotations are available in a text file where each line contains the information of an image according to the following structure:
imageFilename X Y W H
X is x coordinate of the top left corner of the bounding box
Y is y coordinate of the top left corner of the bounding box
W is the width of the bounding box
H is the height of the bounding box
Example for the 3rd subject
003_01.jpg 45 78 100 200
003_02.jpg 450 306 490 524
Let W={w1,w2,...,wN} be the set of subjects in the watchlist, G be the set of training images and P the set of images in the test set.
The participants are expected to provide an algorithm capable of performing the following task:
Example of the application functioning, through command-line:
The elements of the expected output text file should be separated by a white-space, and each line should contain the similarity scores of each probe image.
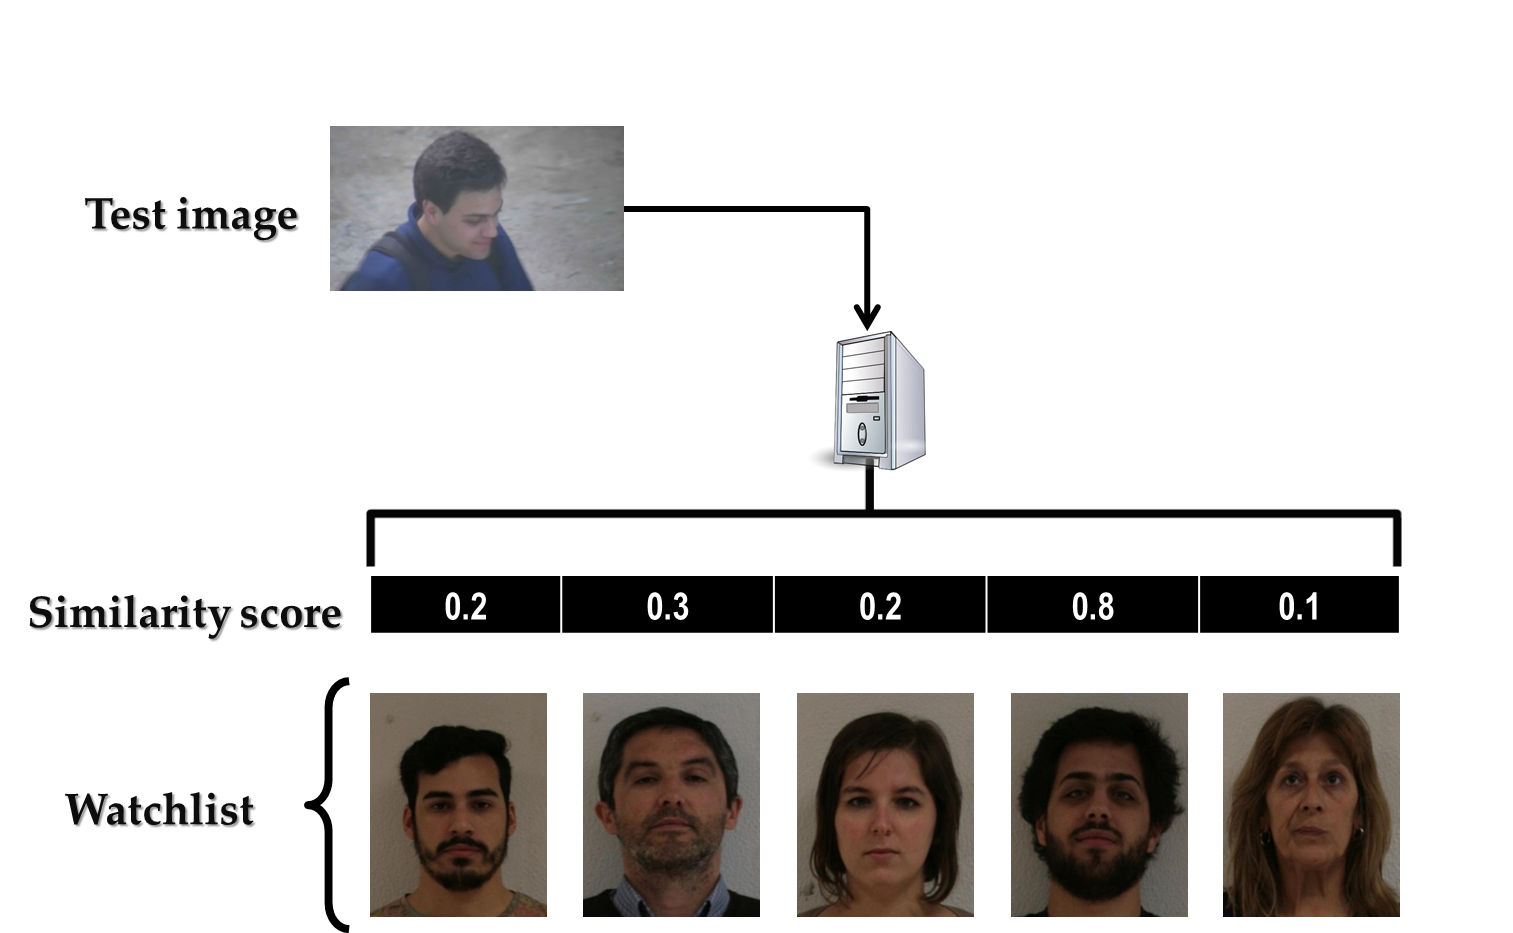
Fig. 3: ICB-RW fundamental task.
The algorithm performance will be determined by the area under curve (AUC) of the cumulative match score (CMC) curve. For this purpose, 5 probe images will be used, which are disjoint from the ones used by the participants.
For each probe image Pi , a rank-K list is constructed by selecting the K most similar watchlist subjects. The CMC curve relates the percentage of correct identification for all probe images with the size K of the rank-K list.
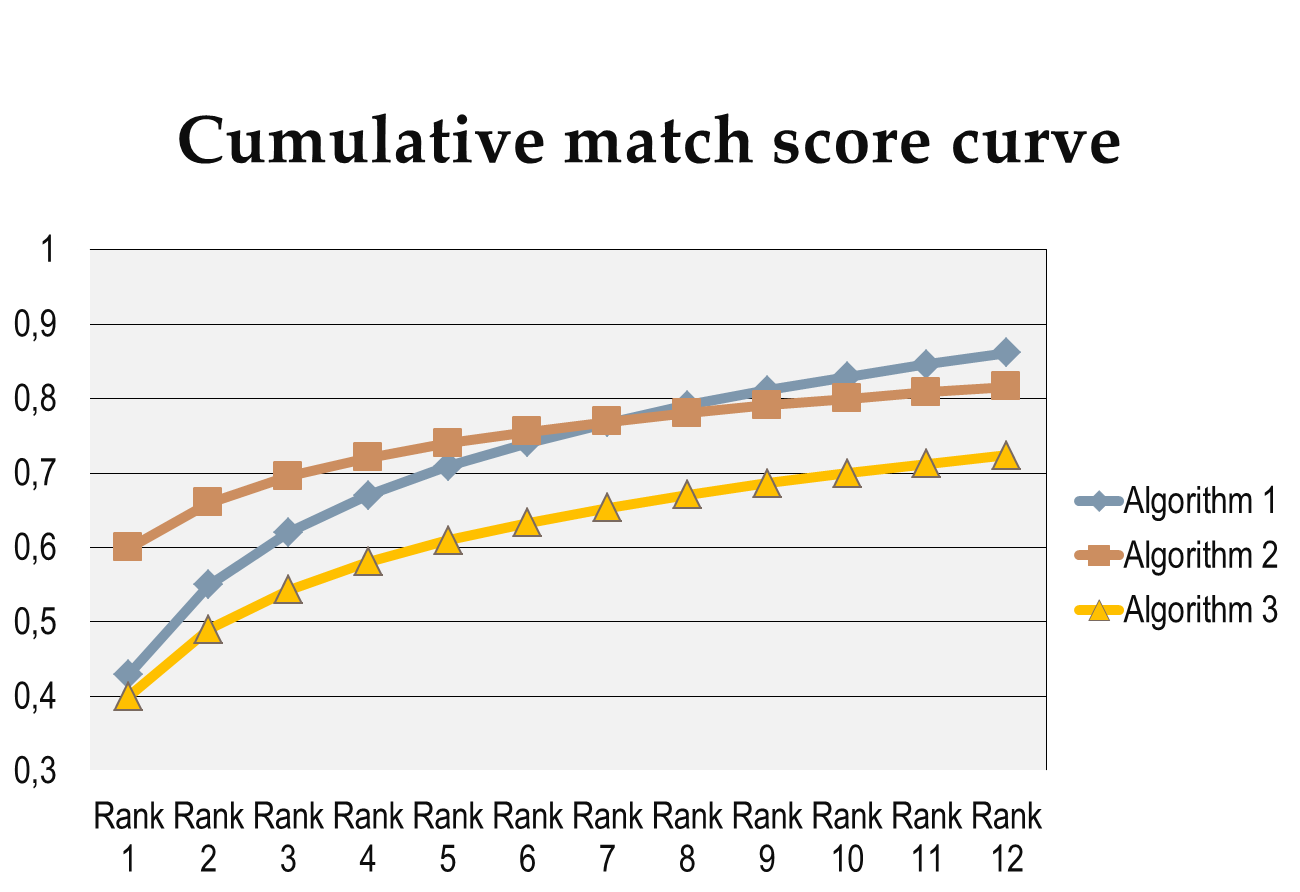
Fig. 4: The CMC curves used to rank participants.
[1] X. Zhu, D. Ramanan, "Face Detection, Pose Estimation, and Landmark Localization in the Wild", Computer Vision and Pattern Recognition (CVPR), 2012
